


 October 16, 2026
Short answer
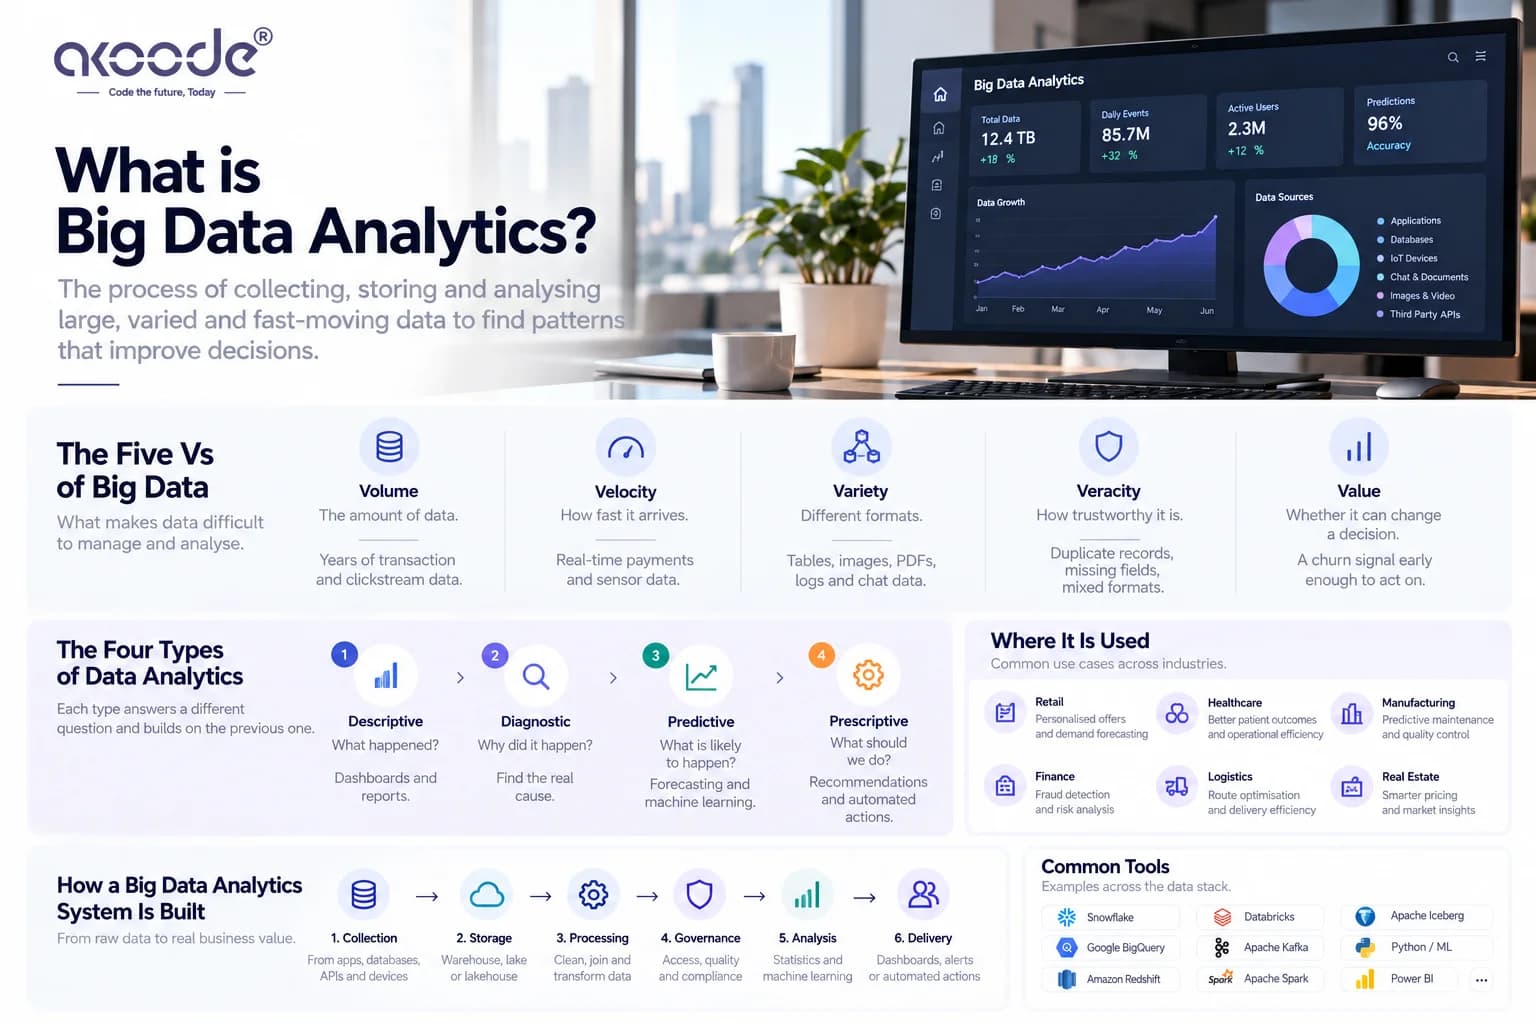
Big data analytics is the process of collecting, storing and analysing data that is too large, too varied or too fast for traditional tools, in order to find patterns that improve decisions. It works in layers: data is collected from many sources, stored in a warehouse or lakehouse, cleaned and processed, analysed with statistics or machine learning, and delivered as dashboards, forecasts or automated actions.
Last updated 16 October 2026. Statistics are dated and sourced where used.
What Big Data Analytics Means
Every business already produces data: sales records, app events, support tickets, sensor readings, payment logs. "Big data" is the point where that data stops fitting comfortably into a single spreadsheet or database, either because there is too much of it, it arrives too quickly, or it comes in too many shapes. Analytics is what you do with it to answer questions. Put the two together and you get big data analytics: the techniques and systems that turn very large, varied or fast-moving data into decisions.
Size is the least interesting part of the definition. A retailer with ten million transactions a year may not have a big data problem at all. A hospital network combining scans, clinical notes, device readings and billing records has one, even at a modest volume, because the variety is the hard part. The useful test is whether your current tools can no longer answer your questions reliably, quickly or at a sensible cost.
The Five Vs, Without the Buzzwords
Practitioners describe big data with five properties. They are useful as a checklist for what makes your data difficult.
Property | What it means | A practical example |
|---|---|---|
Volume | The amount of data | Years of clickstream and transaction history |
Velocity | How fast it arrives and must be handled | Card payments that need a fraud check in milliseconds |
Variety | The range of formats | Database rows, PDFs, images, chat logs, sensor feeds |
Veracity | How trustworthy it is | Duplicate customers, mixed-script names, missing fields |
Value | Whether it can change a decision | A churn signal that arrives early enough to act on |
For most Indian businesses, veracity is the property that causes the most pain. Addresses without a standard format, names in more than one script and customer messages that mix Hindi and English all need cleaning before any analysis can be trusted.
The Four Types of Data Analytics
These four types are the most useful way to understand what analytics can do, and they build on each other.
Descriptive analytics tells you what happened: monthly sales by region, website traffic last week. This is what most dashboards do, and it is the foundation for everything else.
Diagnostic analytics tells you why it happened. Sales fell in one region because a delivery partner failed, not because demand dropped. It needs data from several systems joined together, which is why integration comes first.
Predictive analytics estimates what is likely to happen: which customers will leave, what demand will look like next month, which machine is about to fail. It uses statistical models and machine learning trained on historical data.
Prescriptive analytics recommends or triggers an action: reorder this stock now, route this vehicle differently, hold this payment for review. It sits on top of prediction and is the closest to automation.
Most businesses we meet are strong at the first type, partly doing the second, and want the third and fourth. Skipping the early types is why predictive projects fail. A model cannot learn from data you have not yet joined or cleaned.
How a Big Data Analytics System Is Built
The architecture has six layers. Our big data and data analytics services follow the same structure.
1. Collection. Data is pulled or pushed from applications, databases, APIs, files and devices. Some of it arrives in scheduled batches and some as a continuous stream.
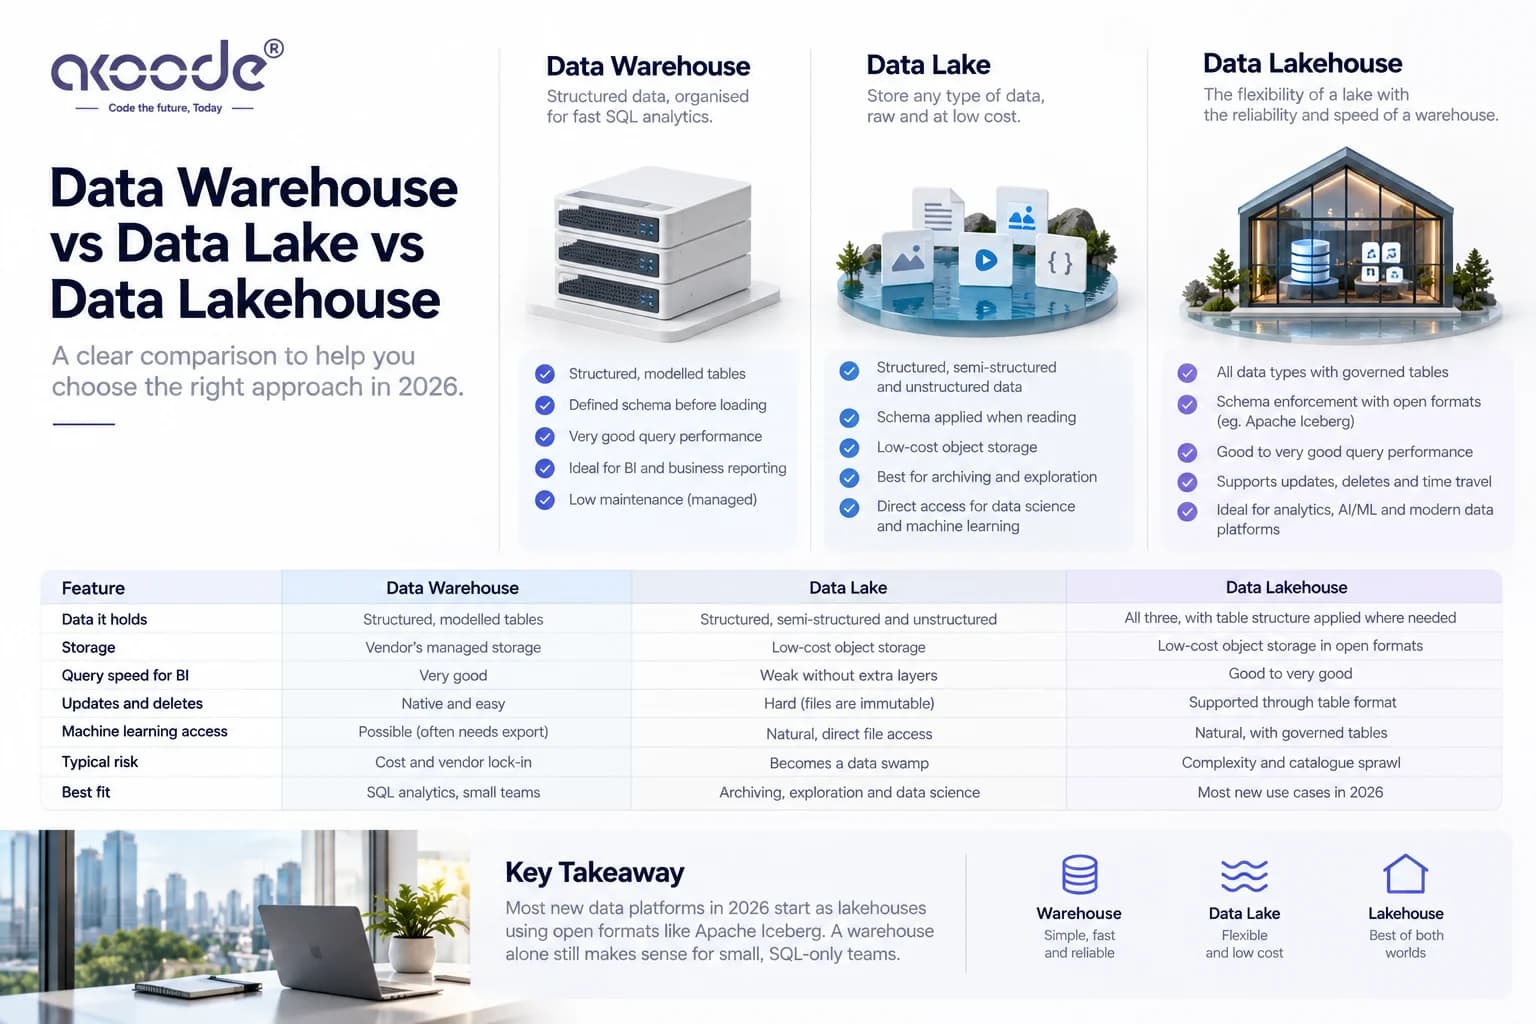
2. Storage. Data lands in a warehouse, a lake or a lakehouse. The choice depends on your data types and how people query it, and we explain it in data lake vs data warehouse vs data lakehouse.
3. Processing. Raw data is cleaned, deduplicated, standardised and joined. This layer takes the most effort and gets the least attention.
4. Governance. Rules for who can see what, where each number came from, how long data is kept and how consent is recorded. Quality tests run here, so a bad record is caught before it reaches a report.
5. Analysis. Statistical analysis, forecasting and machine learning models run on the clean data.
6. Delivery. Results reach people and systems as dashboards, alerts, APIs or automated actions. An insight that stays inside a data team's notebook has no business value.
Tools You Will Meet Along the Way
The tool market is crowded, and the names change. What matters is the job each category does.
Job | Common options |
|---|---|
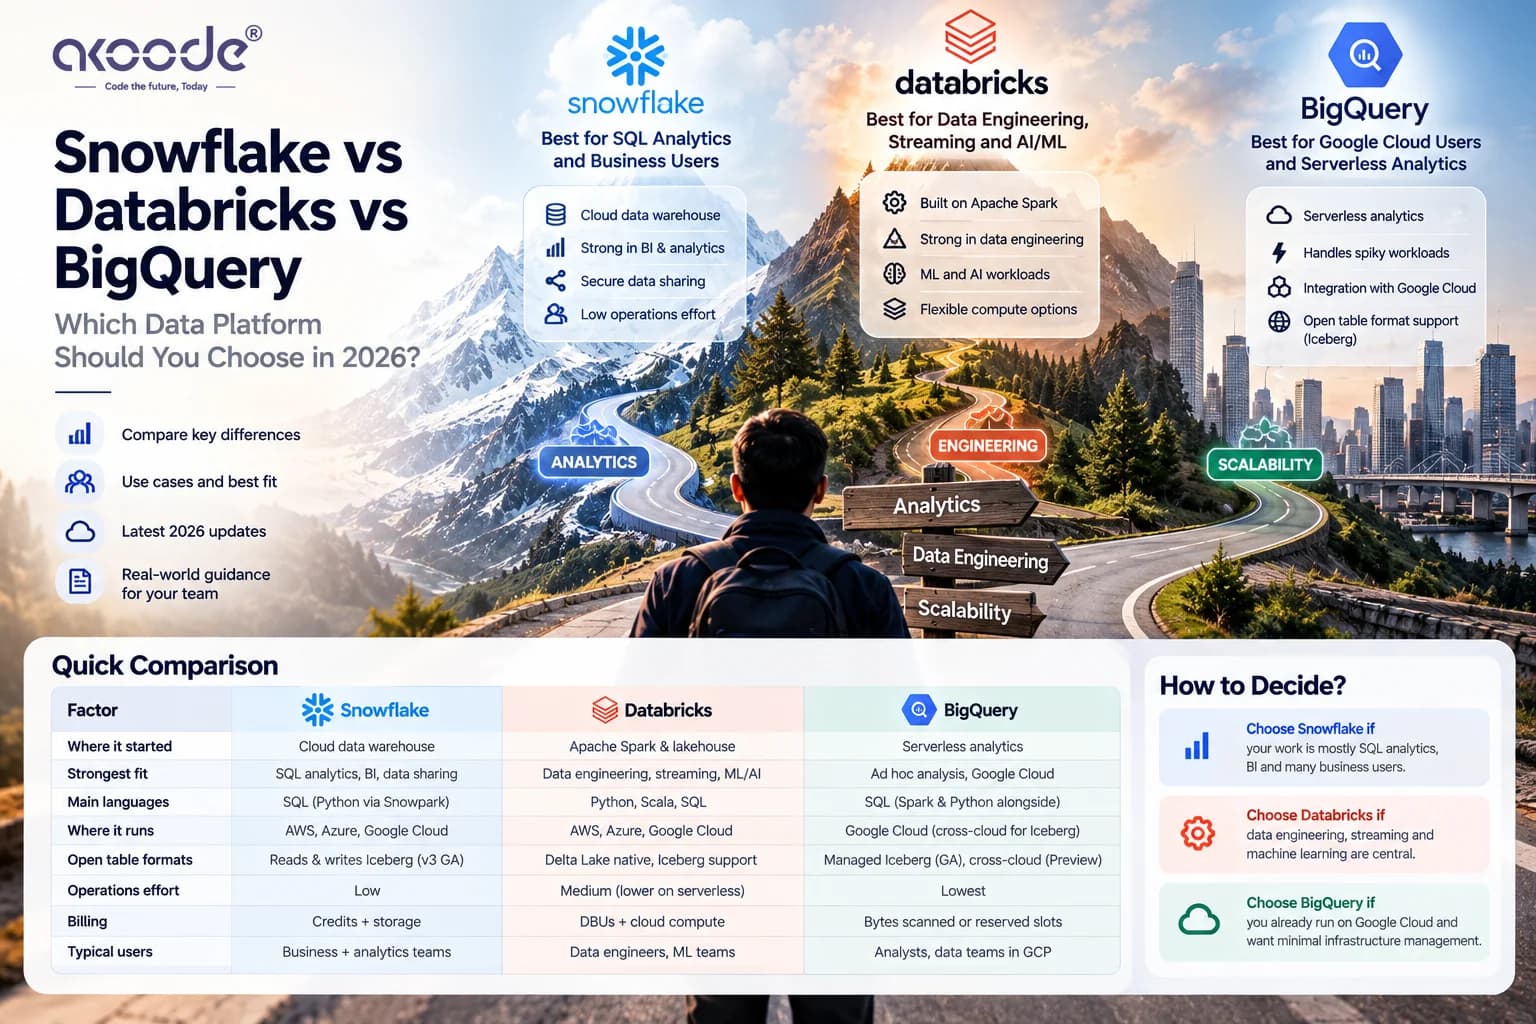
Cloud data platforms | Snowflake, Databricks, Google BigQuery, Amazon Redshift (compared in Snowflake vs Databricks vs BigQuery) |
Streaming and ingestion | Apache Kafka, change data capture tools, managed streaming services |
Processing engines | Apache Spark, SQL engines, Flink for streaming |
Open table formats | Apache Iceberg, Delta Lake |
Machine learning | Python with scikit-learn, TensorFlow, PyTorch |
Dashboards | Power BI, Tableau, Looker and open-source tools |
Cloud infrastructure | AWS, Azure, Google Cloud, managed through cloud and DevOpspractice |
Do not start with the tool list. Start with the business question, then pick the lightest set of tools that answers it. Our team chooses tools after assessing data volume, team skills and where your data is allowed to live.
Where Big Data Analytics Is Used
These are patterns we see across the sectors our team has worked in. The details change but the logic repeats.
Finance and banking. Transaction streams are scored for fraud while the payment is still in flight. A batch report that flags a fraudulent UPI or card transaction the next morning is too late. See our finance and banking work.
Retail and eCommerce. Payment methods, returns, inventory and browsing behaviour are joined so pricing and stock follow demand, including festival peaks. Cash-on-delivery returns behave very differently from prepaid ones, and the data model has to reflect that. More in retail and eCommerce and our guide on what actually works in AI for ecommerce.
Manufacturing. Sensor data from equipment feeds predictive maintenance models that flag a failing part before it stops a line. This is one of the clearest, most measurable returns in analytics. See manufacturing and IoT development.
Healthcare. Operational and clinical data helps hospitals manage capacity and spot risk early, under strict privacy rules. See healthcare.
Logistics. Carrier, warehouse and field data is unified so delays and demand can be forecast. Indian last-mile data needs address cleaning first. See logistics and supply chain.
Energy and utilities. Metering and grid data supports load management. We go deeper in AI energy management and smart grid analytics.
How Big Is the Market, and Why the Numbers Disagree
If you search for the size of the big data analytics market in 2026, you will find answers that differ by a factor of nearly fifty. One research house (Straits Research) estimates the global market at about USD 11.7 billion for 2026, while another (Precedence Research) puts it at around USD 560 billion. The gap comes from definitions: some count only analytics software, others add services, hardware and cloud infrastructure. Quote a range and name the scope, never a single number.
For India, IMARC Group estimated the data analytics market at USD 3.3 billion in 2025 and forecasts growth of 26.37% a year to USD 28.9 billion by 2034. Other firms size narrower segments differently, so use these as direction.
The more useful signal for a buyer comes from the platform vendors. Snowflake reported product revenue up 37% for the quarter ended 31 July 2026, and Databricks told Reuters in August that its annualised run-rate had passed USD 7 billion. Companies are spending more on data foundations because AI needs them.
Why Data Quality Decides Whether Analytics and AI Work
The most common failure in analytics is not the model. It is the data. Gartner predicts that through 2026 organisations will abandon 60% of AI projects that are not supported by AI-ready data. A Gartner survey of 1,203 data management leaders found that 63% either do not have, or are unsure they have, the right data management practices for AI.
That is why our projects begin with quality and governance, not models. A forecast built on duplicated customers or inconsistent product codes will look confident and be wrong. If you plan to build chatbots or assistants on internal data, the same rule applies, and our piece on rebuilding first-generation RAG shows how retrieval fails when the underlying data is weak.
Privacy and Compliance You Cannot Skip
Big data analytics usually involves personal data, which brings legal duties. In India the DPDP Rules were notified in November 2025, with consent manager provisions starting in November 2026 and most remaining obligations applying from 13 May 2027. Plan for consent records linked to the data they cover, retention rules that delete on schedule, and a way to answer access and erasure requests. Other markets add their own rules, such as HIPAA for US health data, GDPR and UK GDPR in Europe and the UK, and personal data protection law in the UAE. Where policy requires data to stay in India, the main cloud providers offer Indian regions. This is engineering guidance, not legal advice.
A 90-Day Plan to Get Started
Days 1 to 15: choose one question. Not a platform, a question. For example, "which customers are likely to cancel in the next 60 days?" Name who will act on the answer.
Days 16 to 35: audit and connect. List the sources that bear on that question, check their quality and ownership, and connect the two or three that matter most. Fix the worst data problems now.
Days 36 to 60: build the foundation. Load the data into a warehouse or lakehouse sized for the question, add quality tests, and reconcile numbers against the source systems until they match.
Days 61 to 90: deliver and measure. Put the answer in front of the decision-maker as a dashboard or alert, and measure whether decisions changed. Only then widen scope or add prediction.
This is the same rhythm we follow in client engagements: a focused setup with one or two sources feeding a dashboard typically takes four to eight weeks, and a full pipeline with a warehouse and BI layer three to six months, depending mostly on source data quality.
Mistakes That Waste the Most Money
Buying tools before defining the question. A platform with no named use case becomes shelfware.
Building predictive models on unclean data. The output looks authoritative and is unreliable.
Over-building real time. Streaming costs more to build and run. Use it when acting a day late costs money.
Running three BI tools. Different tools report different numbers for the same metric. People stop trusting all of them.
Nobody owns the data. Without named owners, quality decays silently.
No plan to operate it. If your team cannot run the platform after launch, hire for it or bring in a partner. Our guide to hiring a dedicated AI developer in India covers one route.
Frequently Asked Questions
What is big data analytics in simple words?
It is the practice of collecting very large, varied or fast-moving data, storing it in a system built to handle it, cleaning it, and analysing it to find patterns that help a business decide something. The output is usually a dashboard, a forecast or an automated action.
What are the 5 Vs of big data?
Volume, velocity, variety, veracity and value. Volume is how much data you have, velocity is how fast it arrives, variety is how many formats it comes in, veracity is how trustworthy it is, and value is whether it can improve a decision.
What are the four types of data analytics?
Descriptive analytics explains what happened, diagnostic analytics explains why, predictive analytics estimates what will happen, and prescriptive analytics recommends or triggers an action. Each type builds on the one before it, so skipping the early types usually causes later projects to fail.
What is the difference between big data and data analytics?
Big data describes data that is too large, varied or fast for traditional systems. Data analytics is the practice of extracting insight from data of any size. Big data analytics applies analytical methods to that harder class of data, usually on cloud platforms built to scale.
Which tools are used for big data analytics?
Common choices include cloud data platforms such as Snowflake, Databricks and Google BigQuery, Apache Kafka for streaming, Apache Spark for processing, Apache Iceberg or Delta Lake as table formats, Python for machine learning, and Power BI, Tableau or Looker for dashboards. The right set depends on your data volume, team skills and data residency rules.
How long does a big data analytics project take?
A focused setup with one or two sources feeding a dashboard typically takes four to eight weeks. A full pipeline with a warehouse and integrated BI usually takes three to six months. Real-time and predictive projects vary most, because models need to be validated against real outcomes before anyone relies on them.
Why do so many data and AI projects fail?
Mostly because of the data, not the model. Gartner predicts that through 2026 organisations will abandon 60% of AI projects not supported by AI-ready data. Unclean, siloed or ungoverned data produces unreliable output, which erodes trust until the project is dropped. Quality and ownership work should come first.
Next Step
If you want a clear view of where your data stands and what to build first, our team offers a free assessment call. Explore our big data and data analytics services or book a free assessment call. The natural next read is data lake vs data warehouse vs data lakehouse, which covers how to shape the storage layer.
Get In Touch Now
View More Our Blog