


 August 5, 2026
Why Most Core Web Vitals Advice Does Not Work
There is no shortage of material on this subject, and most of it fails in the same three ways.
It is out of date. Any guide still discussing First Input Delay is describing a metric Google retired in March 2024, replaced by Interaction to Next Paint. If a page tells you to optimise FID, everything else on it was written before the hardest of the three metrics existed in its current form.
It optimises for the wrong instrument. The overwhelming majority of advice is written against Lighthouse scores produced on a developer's laptop. Google does not rank you on that. It ranks you on field data from real Chrome users, and the two frequently disagree by a wide margin.
It gives you a list rather than a diagnosis. Compress images, enable caching, minify CSS, use a CDN. All reasonable, none prioritised, and no method for working out which of them applies to your actual bottleneck. Teams work through the list, ship a dozen changes, watch the number barely move, and conclude that performance work is not worth doing.
This guide takes the opposite approach. Diagnose first, then fix the thing you diagnosed. The measurement section is longer than it would be in most articles because measuring incorrectly is the single most common reason performance projects fail, and every hour spent on the wrong bottleneck is an hour that produces nothing.
We build performance targets into project plans as written acceptance criteria, so this is the method our own web development team runs rather than a summary of published advice.
The Three Metrics, Defined Properly
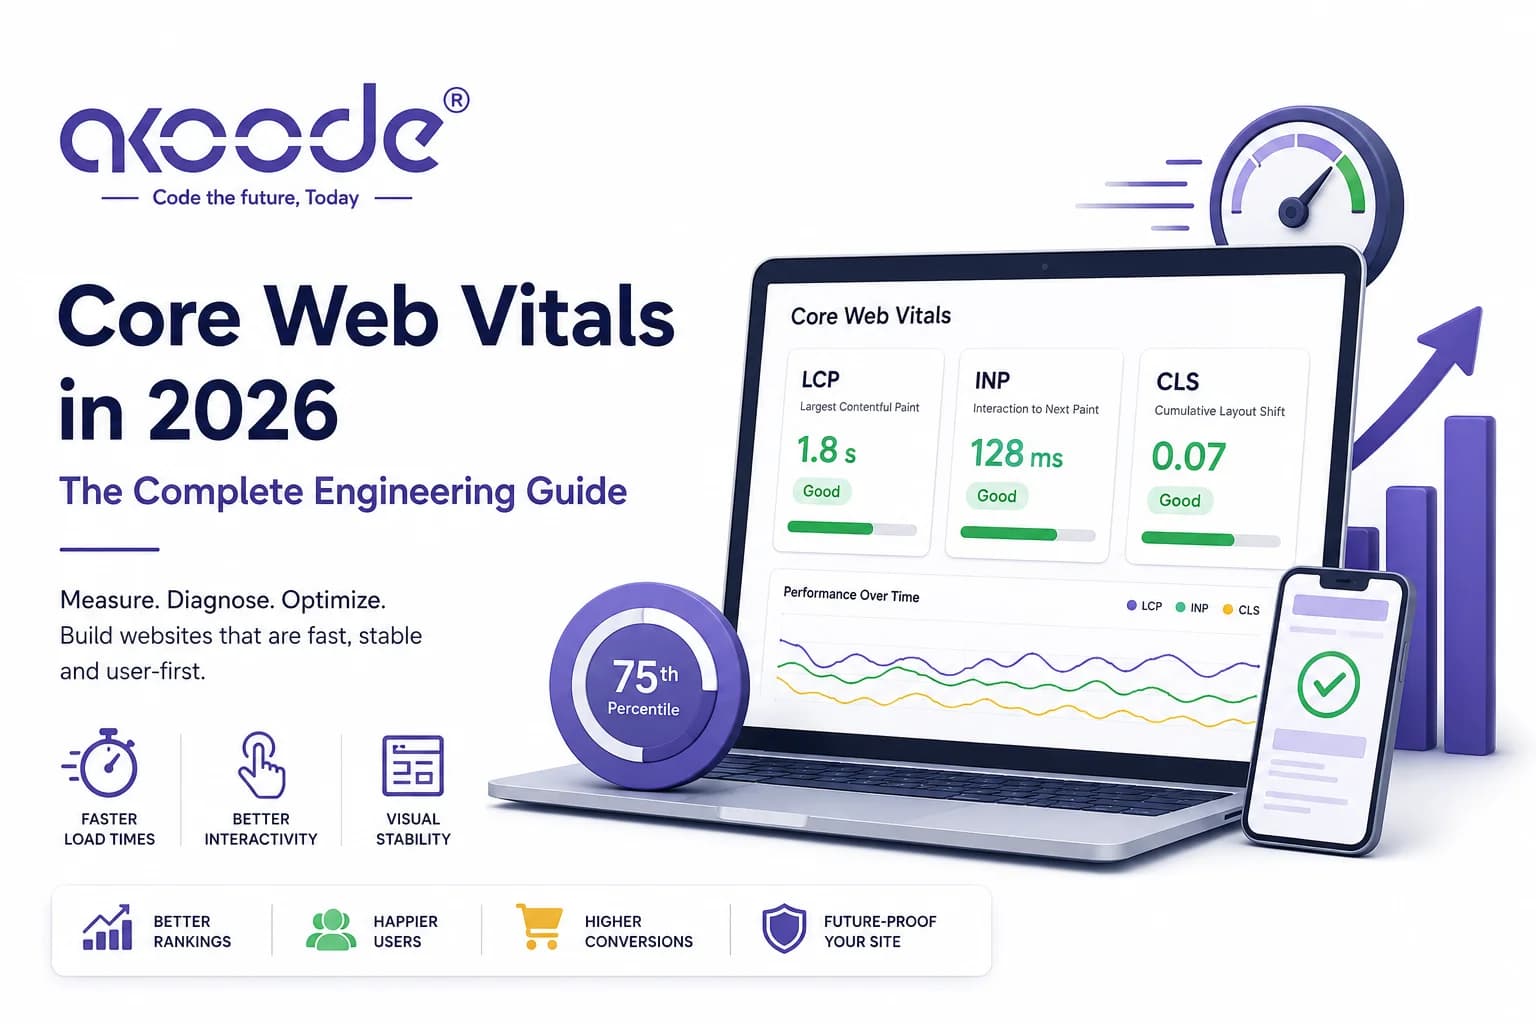
Three metrics. Each measures a different failure mode, and passing requires all three at once.
Largest Contentful Paint (LCP)
What it measures: how long until the largest visible content element in the viewport has rendered. Usually a hero image, a video poster, or a large block of heading text.
Good: 2.5 seconds or faster.
What it means in plain terms: how long the visitor stares at a page that has not visibly arrived yet. This is the metric with the most direct commercial consequence, because a visitor who leaves before LCP has not seen anything you paid to show them.
Interaction to Next Paint (INP)
What it measures: the delay between a user interacting and the browser painting a visible response, measured across the whole interaction lifecycle rather than just the first input. It reports close to the worst interaction on the page, not the average.
Good: 200 milliseconds or faster.
What it means in plain terms: does the site feel responsive when you touch it. This replaced First Input Delay because FID only measured the delay before processing started, which meant a page could score well while feeling terrible. INP measures the whole thing, and a great many sites that comfortably passed FID do not pass INP.
This is the metric most sites fail, and it is the one requiring the deepest engineering change. Compression and caching do nothing for it.
Cumulative Layout Shift (CLS)
What it measures: how much visible content moves around unexpectedly during the page lifecycle, scored as a unitless value combining how much moved and how far.
Good: 0.1 or lower.
What it means in plain terms: the button that moves as you go to tap it. The paragraph that jumps because an ad loaded above it. CLS is the cheapest of the three to fix and the easiest to reintroduce, because a single new script can undo months of work.
The Measurement Trap: Field Data vs Lab Data
This section decides whether the rest of your performance work is useful or wasted.
Lab data is a synthetic test. Lighthouse in Chrome DevTools, PageSpeed Insights' lab section, WebPageTest. One simulated device, one simulated network, one moment. Reproducible and diagnostic, which makes it excellent for finding causes.
Field data is what actually happened to real Chrome users on real devices over real networks. Google collects it through the Chrome User Experience Report and uses it, not your lab score, for ranking.
Three properties of field data change how you should work:
It is measured at the 75th percentile. You pass when at least three quarters of real page views hit the good threshold. The median is irrelevant. This means your worst-served quarter of visitors decides your grade, and those are disproportionately people on mid-range Android phones over congested mobile networks. In India, and in most markets where mobile-first is the reality rather than a slogan, that group is very large.
It moves on a 28-day rolling window. Deploy a fix today and the reported number will drift toward the new reality over the following month rather than jumping. Teams that check three days later, see no change, and revert a good fix are more common than you would expect. Give any change four to six weeks before you judge it.
It is collected per URL where there is enough traffic, and falls back to a group or origin level where there is not.A low-traffic page can be graded on the behaviour of your whole site, which means fixing your highest-traffic templates lifts pages you never touched.
The practical rule: use lab tools to find causes, use field data to decide whether you have won. Never the reverse. A perfect Lighthouse score with failing field data means your test conditions do not resemble your visitors, and the field data is the one that is right.
How to Test Under Conditions That Match Your Users
Almost every disappointing performance project traces back to testing on the wrong thing. Here is the setup worth standardising on.
Device. A mid-range Android handset from roughly two to three years ago, not a current flagship and not an iPhone on the office desk. The CPU gap between a flagship and a mid-range Android is very large, and INP in particular is a main-thread problem, which makes it a CPU problem, which makes device choice the difference between a passing test and a failing reality. Keep two or three real handsets in the office. They cost less than a single week of misdirected engineering.
Network. Throttled mobile conditions, not office wifi. Your visitor is on a train, in a lift, or in a building with two bars.
Location. Test from where your audience is. A site served from a US region and tested from a US region will lie to you about what an audience in India, the UK or the UAE experiences. Latency is physics and no amount of code fixes distance.
State. Test cold, with an empty cache, in an incognito window with extensions disabled. Your own site is fast for you because you have visited it four hundred times.
Repetition. Run each test at least five times and take the median. Single runs on throttled connections vary enough to send you chasing noise.
Then, separately, instrument real user monitoring so you are collecting your own field data continuously rather than waiting for the CrUX window to tell you something a month late. Google's web-vitals JavaScript library reports all three metrics from real sessions, and piping that into your analytics gives you segmentation CrUX cannot: by device class, by connection type, by template, by country. That segmentation is where the actionable findings live. An overall LCP of 2.4 seconds looks fine until you split by device and discover mid-range Android sits at 4.1.
LCP: Breaking the Number Into Four Parts
The most useful thing you can do with an LCP problem is stop treating it as one number. It decomposes into four sequential phases, and the fix is entirely different depending on which phase is eating your budget.
Phase one: time to first byte. How long before the server sends anything. Slow application code, unoptimised database queries, no caching, cold serverless starts, or a server geographically distant from the user.
Phase two: resource load delay. The gap between the first byte arriving and the browser starting to fetch the LCP element. This phase exists because the browser did not know the resource was needed. Common causes: the image is loaded by JavaScript rather than present in the initial HTML, it sits behind a CSS background rule, a lazy-loading attribute has been applied to an above-the-fold image, or a client-side rendered application has to boot before it can even ask for the hero.
Phase three: resource load duration. How long the resource takes to download once requested. Oversized images, wrong formats, no CDN, no responsive sizing.
Phase four: element render delay. Everything downloaded but nothing painted, because the main thread is busy or a render-blocking resource has not resolved. Web fonts are a frequent culprit, as is a large blocking stylesheet or a hydration pass that has to complete first.
Chrome DevTools' performance panel gives you this breakdown. Get it before you touch anything.
Fixing phase one
Cache aggressively at every layer that will hold still: full page caching where the content permits, object caching for repeated queries, and a CDN with edge caching so most requests never reach your origin. Profile your slowest database queries; on content sites, a small number of unindexed queries usually account for most of the server time. If you are on shared hosting and TTFB is your bottleneck, no amount of frontend work will save you, and the cheapest fix on this entire list is moving to better infrastructure.
Fixing phase two
This phase is where the largest and cheapest wins usually sit, because the problem is almost always that you accidentally hid the resource from the browser.
Put the LCP image in the initial HTML as a real <img> element. Never apply loading="lazy" to anything above the fold; this single mistake is responsible for a substantial share of the failing LCP scores we see in audits, and it is usually caused by a global lazy-loading setting applied without exception. Add fetchpriority="high" to the LCP image so the browser knows it matters more than the six other images on the page. Preload it if it is discovered late. Avoid CSS background images for anything that will be your LCP element, because the browser cannot see them until stylesheets have parsed.
Fixing phase three
Serve modern formats. Serve responsive sizes so a phone is not downloading a 2400-pixel-wide image to display it at 390. Compress properly, which for most photographic content means considerably harder than designers are comfortable with, and test the result at the size it actually renders rather than zoomed in on a large monitor. Put static assets behind a CDN with a long cache lifetime.
Fixing phase four
Preload the fonts used in above-the-fold text and set font-display: swap so text renders immediately in a fallback rather than staying invisible. Inline the critical CSS needed for the initial viewport and load the rest asynchronously. Move non-essential JavaScript out of the critical path. If your framework renders client-side, consider server-side rendering or static generation for the templates that carry your organic traffic, because a client-rendered page cannot beat the boot time of its own bundle.
INP: The Metric Most Sites Fail
INP is where performance work stops being about assets and starts being about JavaScript architecture. It is also where the largest share of failures now sit, which makes it the highest-value skill on this list.
The mechanism is simple even if the fixes are not. Browsers have one main thread. It runs your JavaScript, calculates styles, computes layout and paints. When a user taps something, the browser needs the main thread to process the event and paint a response. If the thread is busy running a long task, the tap waits. That wait is your INP.
Three components make up the number: the delay before the handler can start, the time the handler runs, and the time to render the resulting paint. All three are main-thread problems.
Ship less JavaScript
This is the root fix and every other INP technique is a mitigation of having skipped it. Audit your bundle. Find the dependencies you no longer use, the utility library imported whole for two functions, the date formatter that ships every locale, the carousel on a page with one slide. Code-split by route so a visitor landing on a blog post does not download the checkout logic.
Break up long tasks
Any task holding the main thread beyond about fifty milliseconds blocks interaction. Long tasks typically come from large synchronous loops, heavy component rendering, expensive parsing, or a third-party script doing something ambitious on load.
The fix is to yield. Break work into chunks and hand control back to the browser between them so a pending interaction can be serviced. Modern browsers offer scheduling APIs for exactly this, and the pattern of "do a slice, yield, do the next slice" is worth learning properly because it applies everywhere.
Defer work that does not need to happen now
Analytics initialisation, chat widgets, personalisation logic, A/B testing frameworks, tracking pixels. None of these need to run before the user can interact. Load them after the page is interactive, or on first interaction, or when the browser reports itself idle.
Make handlers cheap and updates visual-first
When a user taps, paint something immediately and do the heavy work afterwards. Update the button state, then yield, then run the expensive operation. The perceived responsiveness comes from the paint, not from the completion.
Debounce or throttle handlers attached to high-frequency events. An input handler firing on every keystroke and running an expensive filter is a classic INP failure on search and listing pages.
Watch for layout thrashing
Reading a layout property and then writing a style, in a loop, forces the browser to recalculate layout repeatedly within a single frame. Batch your reads, then batch your writes. This one is invisible in code review and obvious in a performance trace.
Where INP failures concentrate
Pages with heavy interaction carry the risk: filter-heavy listing and category pages, checkouts, forms, dashboards, and anything with a live search. If your site has these, measure them separately rather than trusting a homepage number. Your homepage is almost certainly your best-performing template and your least commercially important one for this metric.
CLS: Easy to Fix, Easy to Regress
CLS is the most tractable of the three. The causes are a short list and the fixes are mostly mechanical.
Images and video without dimensions. Set explicit width and height attributes, or a CSS aspect ratio, on every image, video, iframe and embed. The browser then reserves the correct space before the file arrives. This is the single largest source of layout shift on content sites and it takes an afternoon.
Ads, embeds and widgets. Reserve a container of fixed minimum height sized to the most common slot dimension. An empty reserved box is better than content jumping. If the slot may go unfilled, collapse it after the page has settled rather than during load.
Web fonts. A fallback font with different metrics causes a reflow when the web font swaps in. Preload the font, use font-display: swap, and set fallback metric overrides so the substitute occupies close to the same space as the final font. The overrides are underused and they eliminate most font-driven shift.
Content injected above existing content. Cookie banners, promotional bars, notification strips. If it renders after the page, it pushes everything down. Either reserve space for it or overlay it rather than inserting it into flow.
Dynamic content loading. Skeleton placeholders sized to match the content that will replace them. If the placeholder is a different size to the real thing, you have moved the shift rather than removed it.
One warning. CLS is the metric most likely to regress after you have fixed it, because a single marketing tag, a new embed, or a personalisation script inserted into the flow can undo the work in one deploy. This is the argument for automated monitoring rather than a one-off cleanup.
Fixes Ranked by Effort Against Impact
Most lists give you everything at once. Here is the order we work in, which sequences by return rather than by category.
Tier one: do these first
Fix | Metric | Effort | Why it ranks here |
|---|---|---|---|
Remove lazy loading from above-the-fold images | LCP | Minutes | Frequently the single largest LCP win available, and it is a one-line change |
Set explicit dimensions on all images and embeds | CLS | Hours | Usually takes a failing CLS to passing on its own |
Add | LCP | Minutes | Tells the browser what matters; costs nothing |
Preload above-the-fold fonts, set | LCP, CLS | Hours | Removes invisible text and font-swap shift together |
Reserve space for ad slots, banners and injected content | CLS | Hours | Kills the remaining shift sources |
Defer analytics, chat and tag scripts until after interactive | INP, LCP | Hours | Cheapest meaningful INP improvement available |
Most sites can complete this tier in under a week and it moves more numbers than the next two tiers combined. If you do nothing else in this article, do this.
Tier two: worth planning properly
Fix | Metric | Effort | Why it ranks here |
|---|---|---|---|
Serve modern image formats at responsive sizes | LCP | Days | Large win, needs a pipeline rather than manual work |
CDN and edge caching for static assets | LCP | Days | Compounds with everything else, especially for distant audiences |
Inline critical CSS, load the rest asynchronously | LCP | Days | Directly attacks render delay |
Audit and reduce the JavaScript bundle | INP | Days to weeks | The root INP fix; effort scales with how long it has been neglected |
Code-split by route | INP | Days | High return on sites where one bundle serves every page |
Full page and object caching, query optimisation | LCP | Days | Where TTFB is the bottleneck, nothing else works until this does |
Tier three: architectural
Fix | Metric | Effort | Why it ranks here |
|---|---|---|---|
Break up long tasks, yield to the main thread | INP | Weeks | The real fix for stubborn INP; needs engineering judgement throughout |
Move key templates to server-side rendering or static generation | LCP, INP | Weeks | Structural; frequently the right answer for organic landing pages |
Replace or remove heavy third-party dependencies | INP | Weeks | Often blocked by politics rather than engineering |
Rebuild the frontend | All three | Months | Correct when the current stack has a ceiling below the thresholds |
Tier three is where you end up when a page-builder or plugin-heavy stack cannot get past the thresholds no matter how much remediation is applied. That is a genuine outcome rather than a sales line, and it is worth reaching honestly rather than after two years of tier-one work on a foundation that cannot support it. Our comparison of custom builds against template stacks models what that decision costs over five years.
Platform Notes: WordPress, React and Ecommerce
WordPress and page builders
The pattern is consistent. Plugins each add CSS and JavaScript to every page whether or not the page uses them. Page builders ship a large runtime you cannot remove without losing the editing experience you bought. Themes load icon sets, sliders and animation libraries by default.
What works: audit and remove plugins ruthlessly, then dequeue the assets of the remaining ones on pages that do not use them. Replace multi-purpose plugins with focused ones. Use a proper caching layer and a CDN. Optimise images at upload through a pipeline rather than manually.
What does not work: a performance plugin layered on top of the problem. These help at the margin and cannot remove code the builder requires to function. If you are running a page builder and consistently failing INP, understand that there is a ceiling, and remediation approaches it asymptotically.
React, Next.js and single-page applications
Client-side rendering hurts LCP structurally: the browser must download and execute a bundle before it can begin fetching the content the bundle will display. Server-side rendering or static generation for organic landing pages removes that dependency entirely.
Hydration is the other cost. A server-rendered page that then hydrates a large component tree occupies the main thread precisely when the user is likely to interact, which shows up as INP. Reduce the amount of the page that needs interactivity, defer hydration of below-the-fold components, and keep client bundles small.
If you are on Next.js, the framework gives you image, font and script primitives that handle sizing, priority and loading strategy correctly. Use them rather than raw tags; they exist because these problems are easy to get wrong.
Ecommerce and listing pages
Category and filter pages are the hardest INP surface on most sites: large DOM, live filtering, sorting, and frequently a third-party search or personalisation layer. Prioritise these over the homepage in any performance programme, because they sit directly on the revenue path. Virtualise long lists, debounce filter handlers, and paint the filtered state optimistically before the results resolve.
The Third-Party Script Problem
On a large share of the sites we audit, third-party code accounts for the majority of main-thread work. It is also the hardest thing to fix, because the obstacle is organisational rather than technical.
Every tag was added by someone who needed it. Analytics, tag manager, chat, heatmaps, A/B testing, retargeting pixels, review widgets, consent management, social embeds. Nobody removes them because nobody owns the total. The tag manager makes it worse by allowing tags to be added without a deploy, which means without review.
A workable approach:
Inventory everything and name an owner for each tag. Half the list will have no current owner, which makes those an easy removal.
Measure each one's cost individually. Block it, measure, restore. Present the numbers in milliseconds of main-thread time. This converts an argument about priorities into a comparison of a specific tool against a specific cost.
Load what remains late. Almost nothing in this category needs to run before the page is interactive. Defer to after load, to first interaction, or to browser idle.
Facade heavy embeds. Video players, maps and chat widgets can be represented by a lightweight placeholder that loads the real thing on click. A YouTube embed that loads on click rather than on page load removes a substantial payload from every visit where nobody watches the video, which is most visits.
Put a gate on the tag manager. New tags require a performance review. Without this, everything above is temporary.
Making It Stick: Budgets, CI and Monitoring
Performance regresses by default. Every sprint adds features, every campaign adds a tag, every new image is larger than the last. A one-off optimisation project buys you roughly a year.
Write a performance budget. Numbers with test conditions attached, agreed by engineering and marketing together. Maximum JavaScript per route, maximum image weight, maximum third-party requests, and targets for all three metrics on a specified device and network. The budget's job is to make trade-offs explicit at the moment they are made rather than in the postmortem.
Enforce it in CI. Run Lighthouse or a similar tool on key templates on every pull request and fail the build when a budget is exceeded. This is the mechanism that actually holds, because it moves the conversation to before the merge. A regression caught in review costs minutes; the same regression found in CrUX six weeks later costs a sprint.
Monitor real users continuously. Collect the three metrics from live sessions with the web-vitals library, segment by device class, connection, country and template, and keep the p75 for each segment on a dashboard someone actually looks at.
Alert below the thresholds, not at them. By the time your 28-day p75 crosses a threshold, the damage has been accumulating for weeks. Set alerts at roughly eighty percent of each limit so you get warned on the trend rather than the failure.
Review after every significant deploy. A metric that moves the day after a release has an obvious cause, and finding it while the change is fresh takes a fraction of the time it takes a month later.
Writing Performance Into a Contract
If you are commissioning a build rather than fixing one, this section is the highest-leverage part of the article. Performance is far cheaper to require than to retrofit.
Put the following in the acceptance criteria:
Specific numbers for all three metrics, not "fast" or "optimised". LCP, INP and CLS with the good thresholds stated.
The test conditions. Named device class, network profile, and test location. A target without conditions is not a target. This clause alone prevents the most common dispute, where a vendor demonstrates a flawless desktop Lighthouse score against a site that fails on the phones your customers own.
Which templates are covered. Homepage, primary landing template, listing or category template, detail template, and any transactional flow. Not "the site", which in practice means the homepage.
A field-data verification window. Lab results at handover, plus confirmation against real user data at a defined interval after launch, since CrUX needs weeks to reflect reality. Tie a portion of the final payment or the support period to it if the project size justifies that.
A performance budget for the ongoing relationship, so the site that launches fast is still fast in year two.
Vendors who build this way will accept these clauses without much argument. The reaction to the clause tells you a great deal about the reaction you would get to a performance problem in month eight.
Your First Two Weeks
A concrete sequence for a team starting from a failing Search Console report.
Days one and two: establish the truth. Pull field data from Search Console and PageSpeed Insights for your top templates. Note which metric fails and by how much. Instrument the web-vitals library so your own collection starts accumulating immediately.
Days three and four: diagnose, do not fix. Run lab tests on a mid-range Android over a throttled connection, from your audience's region, five runs each, median. For LCP, get the four-phase breakdown. For INP, capture a trace while interacting with the page the way a user would. Write down the bottleneck for each template before anyone opens an editor.
Days five to seven: ship tier one. Lazy loading removed above the fold, dimensions set, fetch priority added, fonts preloaded and swapping, space reserved for injected content, third-party scripts deferred. Verify each in the lab as you go.
Week two: inventory and plan. Audit third-party tags with an owner and a millisecond cost against each. Audit the JavaScript bundle. Write the performance budget. Add a CI check on your two highest-traffic templates. Scope tier two into the next sprint.
Then wait. Field data moves on a 28-day window. Do not judge the work before week six, and do not let anyone else judge it before then either. Setting that expectation in advance is part of the job.
How Akoode Approaches This
Performance targets go into our project plans as written acceptance criteria with test conditions attached, and they get verified on mid-range devices rather than office laptops. Speed work is scoped, built and measured rather than hoped for.
Akoode Technologies is a web development and product engineering company based in Gurugram with a US presence in Oklahoma, working with clients across India, the UK, the US and the UAE. We have delivered 180+ projects across 15+ industries, hold a 4.9 rating on Google from 110 reviews and 5.0 on GoodFirms, and our client retention sits at 97%.
A large share of the sites that arrive for audit share the same profile: a build from three or four years ago, plugins layered on plugins, and Core Web Vitals in the red on mobile while the desktop numbers look respectable enough that nobody escalated it. The remediation work is frequently straightforward. The harder conversation is the one about whether the underlying stack has a ceiling below the thresholds, and we would rather have that conversation early than bill for two years of work against a foundation that cannot get there.
If your Search Console report is red and you want a diagnosis rather than a list of generic recommendations, book a slot directly with our founder. Bring the URLs and the report. Our custom website development and web application work both carry performance budgets as standard, and if the answer is that your current site needs remediation rather than replacement, that is what we will tell you.
Frequently Asked Questions
Do Core Web Vitals actually affect Google rankings? They are part of Google's page experience signals and contribute to ranking, though relevance and content quality carry more weight. The practical position is that Core Web Vitals rarely make a poor page rank well, and they frequently act as a tiebreaker between comparable pages. Their commercial effect through conversion and bounce rate is generally larger and more immediate than the ranking effect, which is a better reason to act on them.
Why does my Lighthouse score say 95 while Search Console says my site is failing? Because they measure different things. Lighthouse is a lab test on a simulated device under simulated conditions. Search Console reports field data from real Chrome users at the 75th percentile over 28 days. If they disagree, the field data is correct and your lab conditions are more favourable than your visitors' reality, usually because the test device is faster than what your audience carries.
How long after fixing an issue will my Core Web Vitals improve? Lab results change immediately. Field data moves on a 28-day rolling window, so expect four to six weeks before the reported number settles at its new level. Judging a fix earlier than that is the most common reason good work gets reverted.
Which metric should I fix first? Whichever sits in the poor band, since that is doing the most damage. After that, INP is usually the hardest and most commonly failed, LCP carries the most direct commercial impact, and CLS is the cheapest to fix. Do not spend time optimising a metric that is already passing comfortably.
Can a WordPress site pass Core Web Vitals? Yes, with discipline. A lean theme, a minimal and deliberately chosen plugin set, proper caching, an image pipeline and a good host will get most WordPress sites into the passing range. Page-builder sites are considerably harder because the builder ships code you cannot remove, and INP is where that ceiling usually shows.
What tools do I need to measure Core Web Vitals properly? Search Console for field data at scale, PageSpeed Insights for a per-URL view of field and lab together, Chrome DevTools for diagnosis including the LCP phase breakdown and INP traces, WebPageTest for controlled multi-run testing, and the web-vitals JavaScript library for your own real user monitoring. The last one matters most in the long run because it gives you segmentation the public tools do not.
Is INP harder to fix than the old First Input Delay metric? Considerably. FID only measured the delay before an event handler began, which meant a page could score well while feeling unresponsive. INP measures the full interaction through to the next paint, and it reports close to the worst interaction rather than the first. Many sites that passed FID comfortably do not pass INP, and the fixes require JavaScript architecture changes rather than configuration.
Should performance targets go in a web development contract? Yes, with the test conditions attached. State the three metrics with their thresholds, the device class and network profile they will be verified on, which templates are covered, and a field-data verification window some weeks after launch. A target without conditions is unenforceable, and the vendor's reaction to the clause is itself useful information during selection.
Do Core Web Vitals matter for pages behind a login? Not for ranking, since search engines do not crawl them, but the underlying experience matters as much or more. Dashboards and portals are interaction-heavy, which is exactly where INP problems live, and the users are people who visit daily rather than once. Measure them with your own real user monitoring, because CrUX will not cover them.
How much does it cost to fix Core Web Vitals? Tier one work is typically under a week for most sites and produces the largest share of the improvement. Tier two runs a few weeks depending on the state of the codebase. Tier three is architectural and priced as a project. The honest answer is that diagnosis comes first, because the cost depends entirely on which of the three tiers your bottleneck sits in.
Get In Touch Now
View More Our Blog